Pricing your Near North Central San Antonio home can feel tricky when buyers have more choices and homes take longer to sell. You want a price that attracts attention, holds up during appraisal, and helps you move on your timeline. In this guide, you’ll learn a simple, defensible way to set your list price using local comps, days on market, and condition-based adjustments. You’ll also see how to monitor results and when to pivot. Let’s dive in.
North Central market snapshot
As of December 2025, the San Antonio Board of REALTORS reported a mean sale price near $375,500 and a median near $309,990 in Bexar County, with roughly 5.25 months of inventory and an average of about 92 days on market. These stats point to a more balanced market where buyers compare options and expect value. You will also see meaningful differences inside Near North Central. For example, ZIP 78216 showed list-price medians around the low $300s with price per square foot in the high $170s to low $180s, while 78209’s per-square-foot values were much higher and often took longer to sell. Treat ZIP figures as a starting point, then refine with micro-neighborhood comps drawn from the MLS. SABOR’s monthly MLS report provides the official county-wide snapshot.
Build your CMA in 6 clear steps
1) Define your market area
Start in the same subdivision or within about a half mile for Near North Central’s established blocks. Match street type, lot size, and school district boundaries where relevant. Expand to 1–3 miles only if recent, similar sales are limited. Appraisal guidance stresses tight location matching for best results, especially when you will reconcile to a precise list price. See Fannie Mae’s appraiser update for standards on market analysis and adjustments.
2) Gather recent sold comps
Aim for at least three reliable closed sales from the last 90 days. In balanced markets, recency matters because prices and demand can shift. If you must use sales up to 6–12 months old, note the date and plan to make time adjustments supported by market data. Fannie Mae expects appraisers to analyze at least a 12‑month trend when market movement is present. Review a simple comp-selection guide like this nonappraiser resource for what to match.
3) Add 1–2 active and pending listings
Active and pending properties show where today’s buyers are shopping and what your competition looks like right now. Confirm bed/bath counts, gross living area, lot size, garage count, pools or notable features, and functional utility. Use them to gauge how your home will stack up in photos, pricing, and condition.
4) Create a price-per-square-foot baseline
For each sold comp, divide sale price by finished living square feet. Weight the strongest matches and latest closings a bit more. Average the values to get a local $/sq ft baseline for your micro-market, then multiply by your home’s finished living area. This gives you a market-based starting value before adjustments.
5) Make verified adjustments
Adjust up or down for time, size, bed/bath count, garage, lot characteristics, pools, and condition. Appraisers prefer market evidence like paired sales or trend data, not just replacement cost. If a comp’s remodeled kitchen consistently commands a premium over original kitchens in your area, you would adjust for that difference. Fannie Mae guidance explains the need for objective support, and appraisal pros discuss paired-sales logic in resources like Appraisal Today.
6) Reconcile and set a 30‑day feedback plan
Use your adjusted range to pick one of three strategies: price to market, slightly below market, or higher with clear risk controls. Define how you will measure interest in week 1–3, then plan when to adjust if showings and inquiries lag. San Antonio’s average days on market has been measured in weeks to months, so a 14–30 day check-in keeps you aligned with what buyers are telling you. Reference county-level trends with SABOR’s latest report.
A quick Near North Central example
Imagine your 1,800 sq ft home is in 78216, where recent medians point to about $179–$183 per square foot for typical listings. Here is a simple, illustrative way to think through the math:
- Baseline value: 1,800 sq ft x $183 ≈ $329,400.
- Condition check: recent comparable sales suggest remodeled kitchens in this pocket can trade around a small premium versus original kitchens. If your kitchen is original and market evidence indicates about a 5 percent gap, a conservative working figure might be around $313,000 after adjustment.
- Next step: compare against two or three of your best comps and today’s actives to fine-tune a final list price and launch strategy.
These numbers are examples. Your final CMA should rely on the closest, most recent MLS comps and clearly documented adjustments.
Condition adjustments buyers notice
Cosmetic updates that speed sales
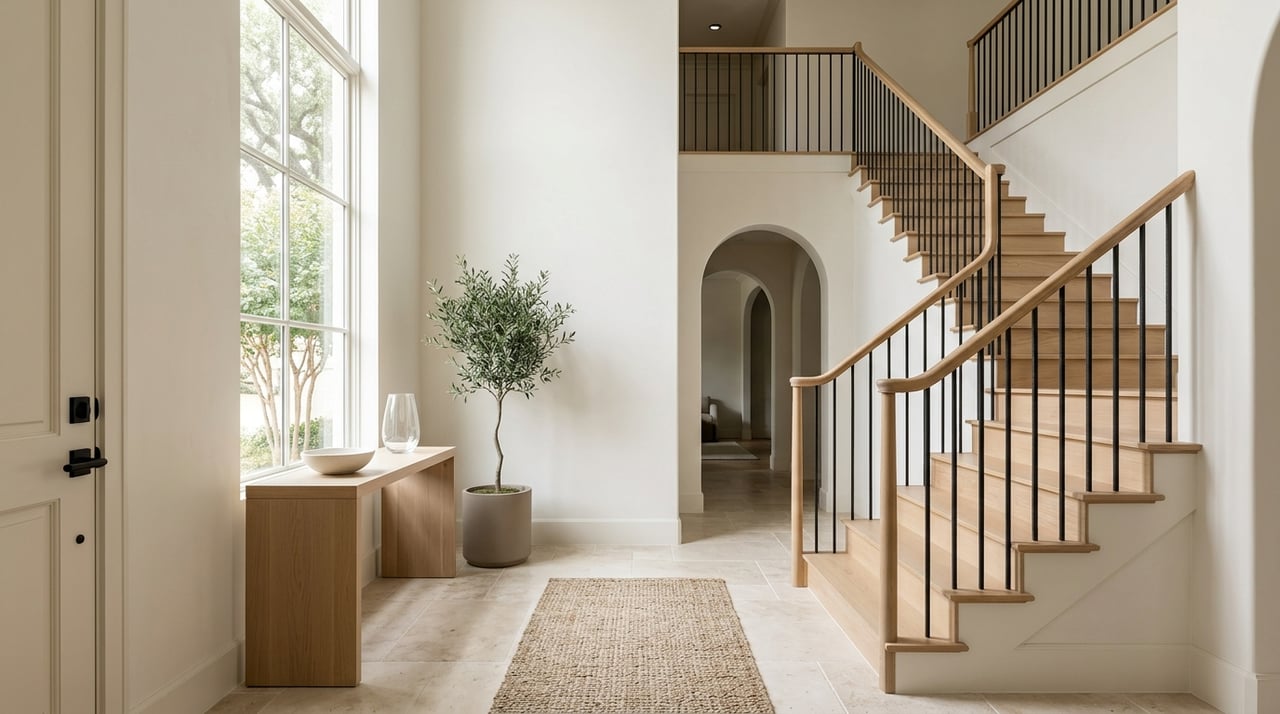
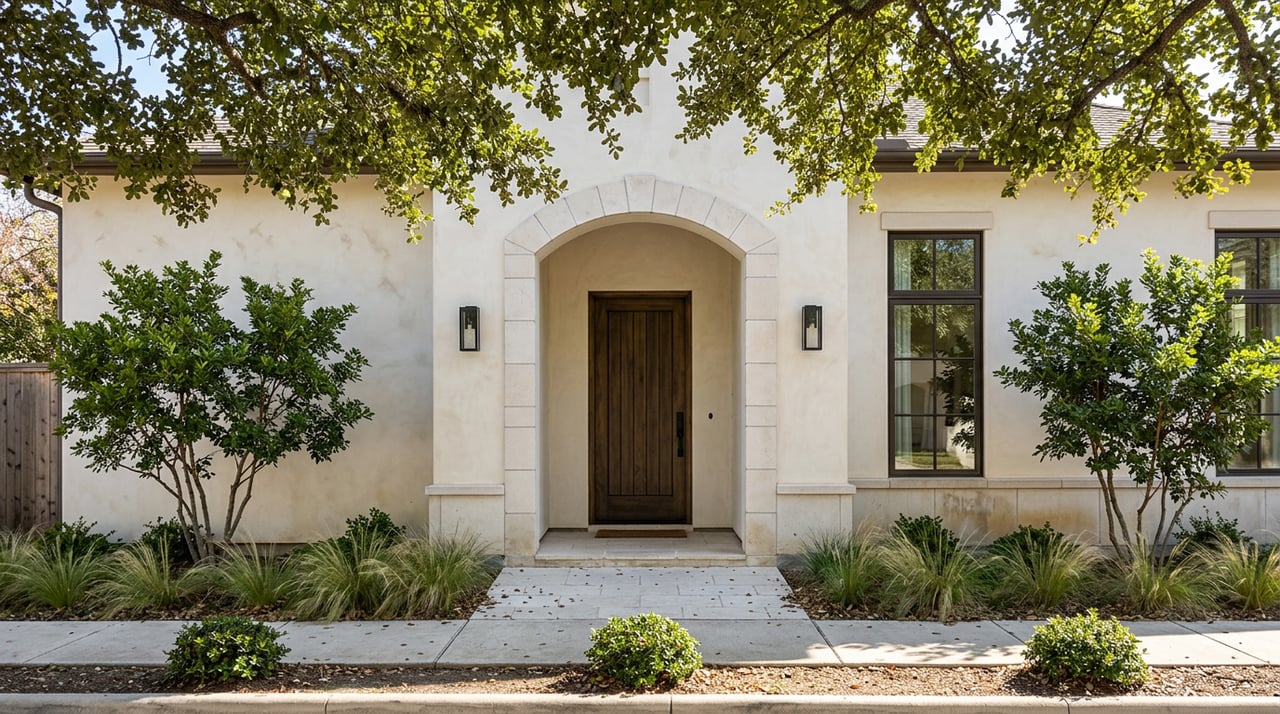
Fresh neutral paint, clean floors, updated light fixtures, and light landscaping can boost appeal and reduce time on market. NAR’s remodeling insights show that straightforward cosmetic work often has strong satisfaction and solid cost recovery. Staging data also points to faster sales and better offers when homes present clean and move-in ready. See the latest NAR staging findings for context.
Systems and structure that affect financing
Roof, HVAC, foundation, and major deferred maintenance can influence buyer confidence and loan approvals. If not addressed, you may face larger buyer credits, lender conditions, or appraisal notes. Appraisers treat these as condition issues and adjust using market evidence, not simple replacement cost, consistent with Fannie Mae’s guidance.
Layout and function that change value
Primary-suite placement, bath count, and awkward floor plans can shift value in ways that differ by micro-market and price tier. The right adjustment comes from how local buyers actually respond, not from a flat rule. Appraisal resources like Appraisal Today explain how paired-sales analysis helps isolate what buyers pay for functional differences.
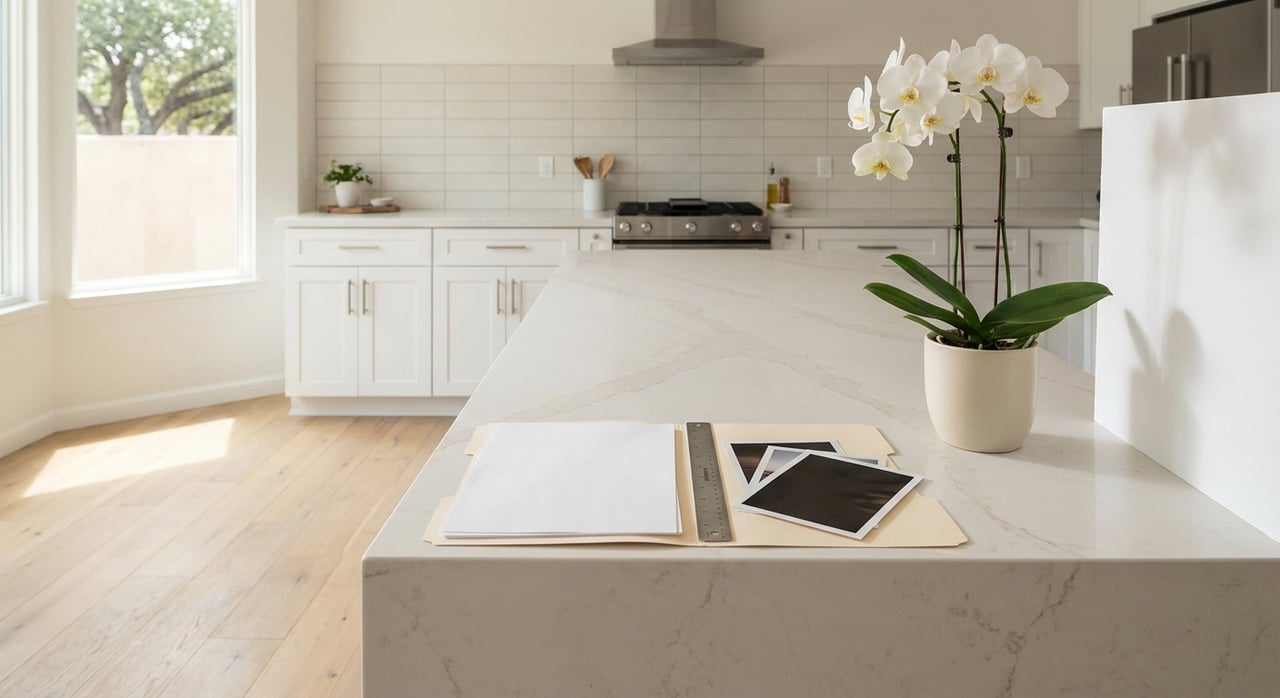
For kitchen and bath work, “minor” updates often outperform full gut renovations on near-term return. Use regional Cost vs. Value data as a directional tool, remembering ROI varies by neighborhood and price tier. A helpful overview is this Cost vs. Value summary.
Smart pricing tactics in 2026
- Price to market. In a balanced to cooling environment like Bexar County late 2025, a well-supported market value often yields the best combination of showings, offers, and appraisal success.
- Price slightly below market. This can spark activity in very tight pockets, but it is riskier when inventory is higher and DOM is longer. Use this only if your comps and today’s actives show clear, surplus demand.
- List high to leave room. Overpricing tends to increase days on market and lead to reductions, which can lower your final net. In a market with more price drops, conservative, market-anchored pricing often wins.
Monitor days on market and react early
Your first 1–3 weeks are your highest-visibility window. Track showings, online saves, and qualified inquiries against nearby actives at similar prices. If you lag behind by week two, consider a price or presentation change within 14–30 days. Pair your results with county trends published by SABOR, and watch your neighborhood’s sale-to-list patterns to stay realistic.
Why a local agent and appraiser matter
A strong Near North Central CMA depends on micro-neighborhood insight, MLS-only closed data, and documented adjustments that hold up with lenders. Appraisers must support time and condition adjustments with objective evidence, as noted by Fannie Mae. Sellers also value agent guidance for pricing and prep, which aligns with findings from NAR’s 2025 Profile of Home Buyers and Sellers. For taxes and exemptions that affect net proceeds and buyer affordability, check the county’s resources such as the Bexar property appraiser portal.
Quick seller checklist
- Pull 3–6 recent sold comps in your subdivision or within 0.5 mile, plus 1–2 active or pending comps for context.
- Build a $/sq ft baseline from the most similar, most recent closed sales.
- Adjust for time, size, bed/bath count, garage, lot, pool, and condition with market support.
- Set a pricing strategy and a 14–30 day feedback plan with clear triggers.
- Knock out high-impact cosmetic updates and confirm system health before listing.
Ready to price with confidence and launch a smooth sale? Reach out to Shawn Alvarez for a local CMA, recommendations tailored to your block, and a plan that fits your timing.
FAQs
How should I price a Near North Central San Antonio home in 2026?
- Start with a tight CMA using recent sold comps in your subdivision, build a $/sq ft baseline, then adjust for time, size, and condition before choosing a pricing strategy.
What if my best comparable sales are older than three months?
- You can extend to 6–12 months, but support time adjustments with local trend data consistent with lender and appraiser standards.
How much do upgrades add to value in San Antonio?
- It depends on your micro-market; use paired sales to see what buyers pay for a feature, and prioritize cosmetic updates that improve presentation and speed.
Should I list below market to spark multiple offers?
- Only if real-time demand in your pocket is very strong; in longer-DOM segments, pricing to market is usually safer and more predictable.
How long should I wait to adjust price if I get few showings?
- Review activity after 1–3 weeks and plan a price or presentation change within 14–30 days if you lag behind similar nearby listings.